Step 3: Calculation of Coupling Measures
In this step, we will be calculating coupling measures between electrodes to determine any temporal correlations.
This allows us to create an adjacency matrix representation of a network graph that we can calcalate network summary statistics on. For more information regarding network graph representations, please check Network Graph Representations.
We support three different correlation measures: the linear Pearson’s Correlation, and non-linear mean phase coherence correlation, and the non-linear correlation coefficient (Pijn’s Measure).
When you get to the Correlation page, you will see the following form. This page works very similarly to the conversion page.
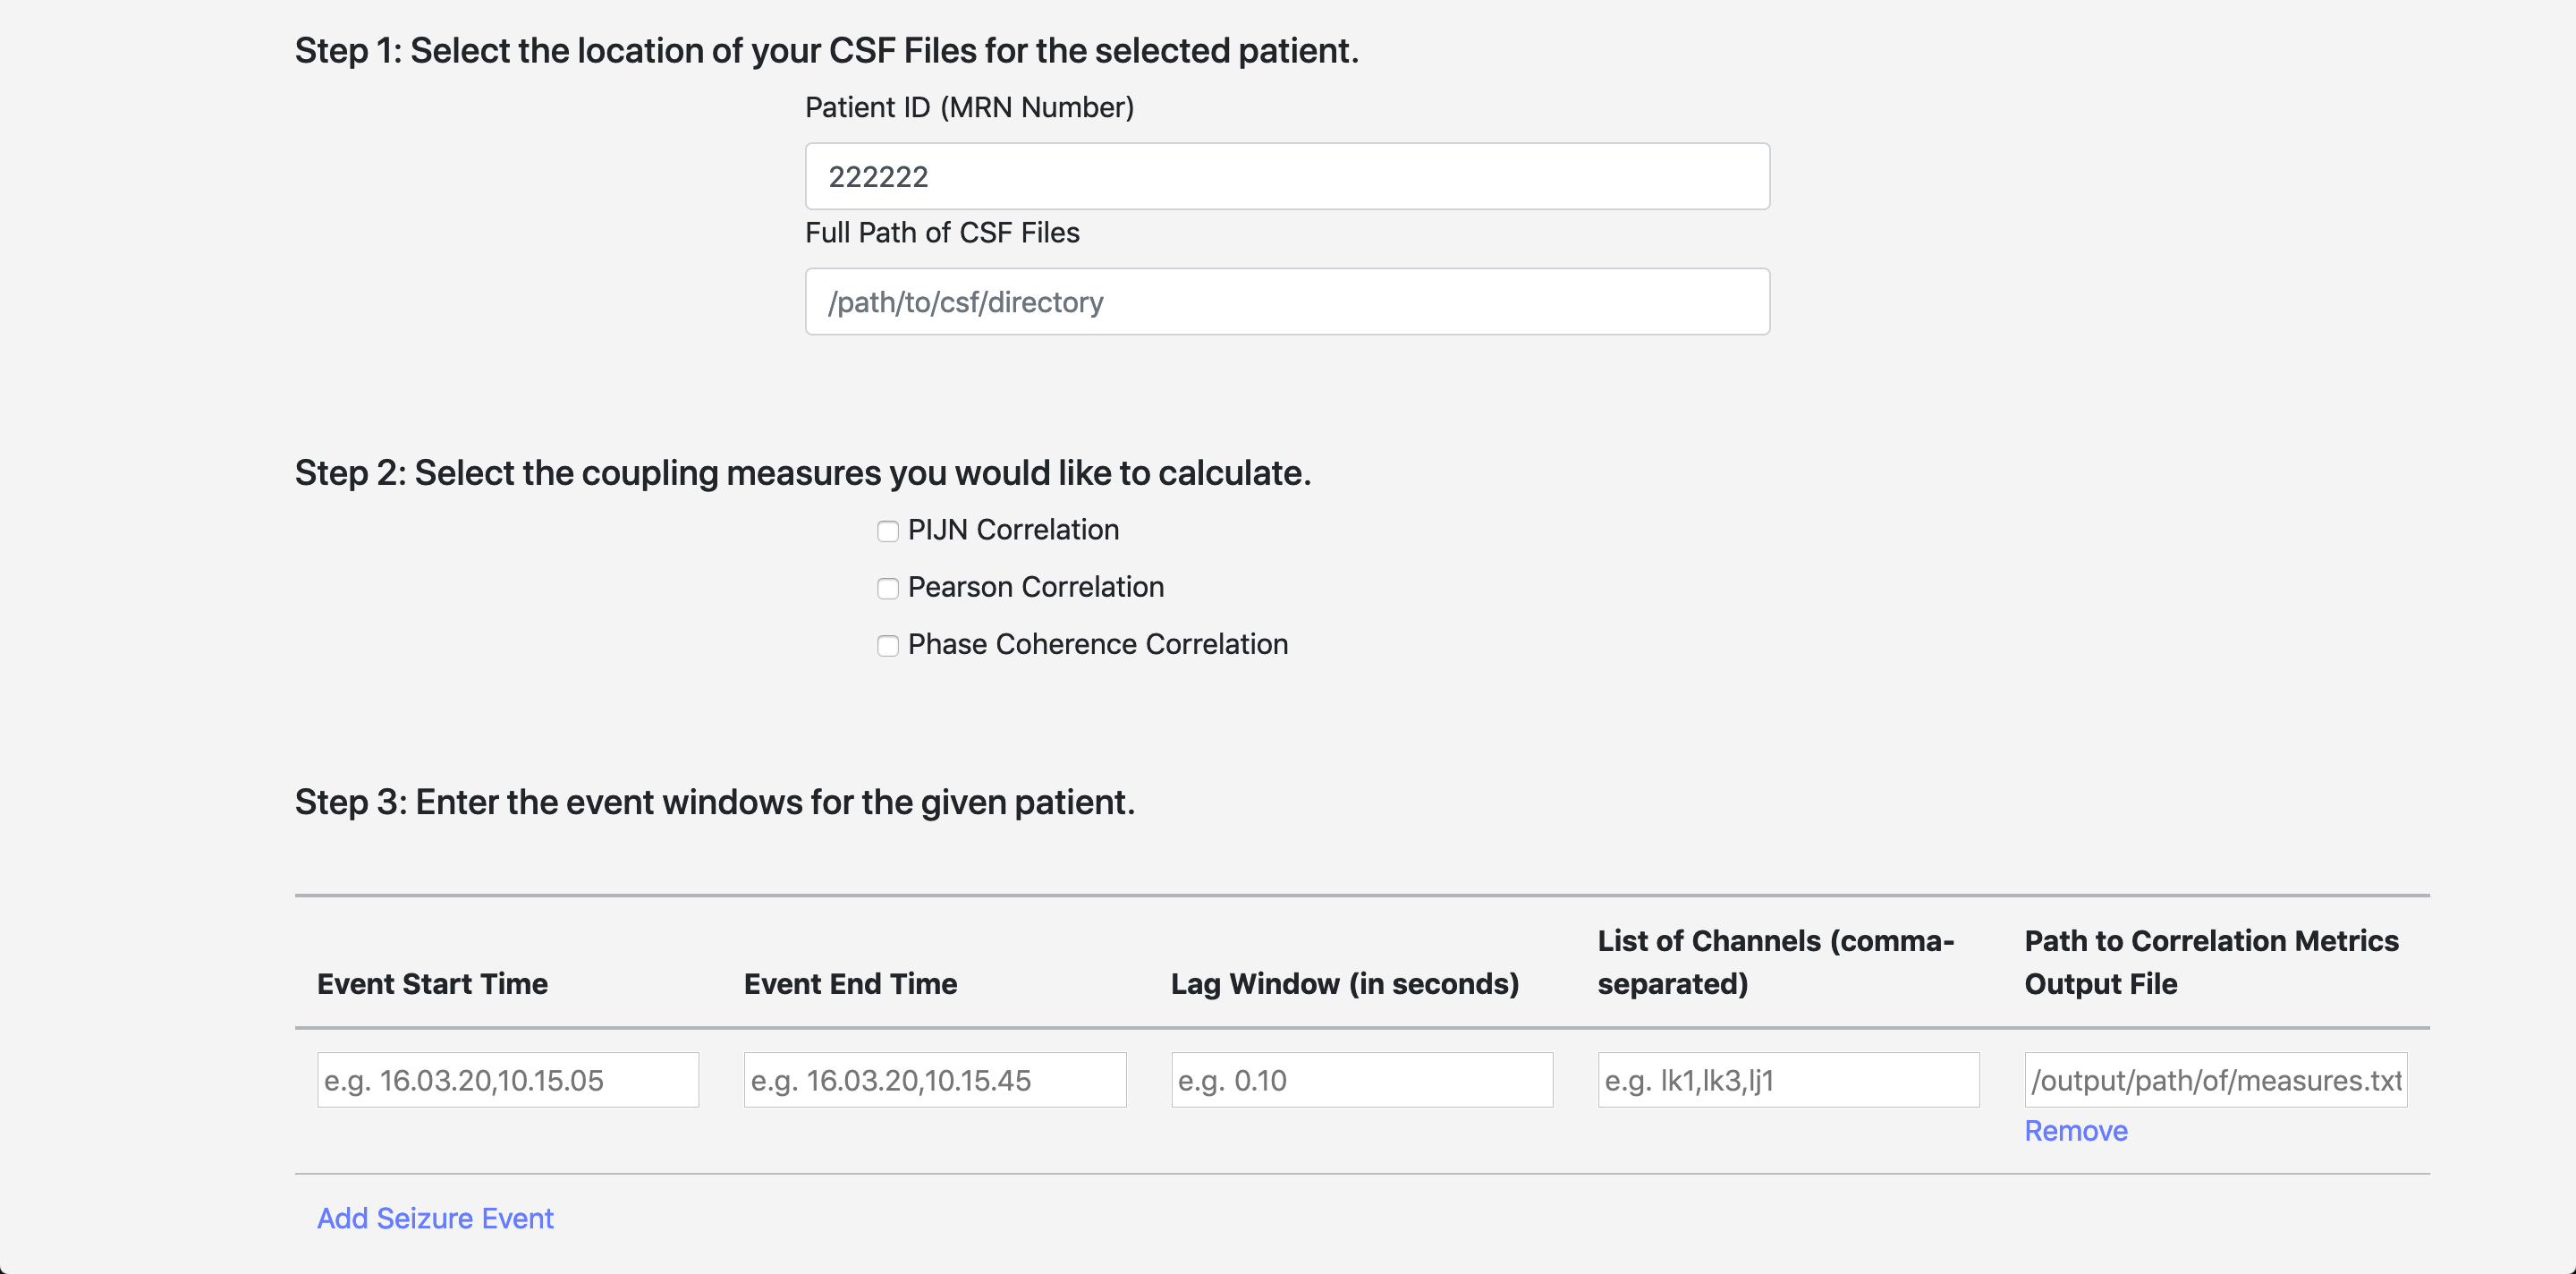
| Input | Description |
|---|---|
| Patient ID | The patient ID from the patient demographics page |
| Path to CSF Files | The full path to the CSF fules produced in step 1. |
| Coupling Measures | The list of coupling measures you’d like to select |
Once you have selected the location of the CSF files (for one patient), you can select as many event windows as you’d like by clicking Add Seizure Event and Remove.
| Input | Description |
|---|---|
| Event Start Time | The start time of the event |
| Event Start Time | The end time of the event |
| Lag Window | The lag window to calculate over |
| List of Channels | The list of electrodes over which you’d like to calculate correlations |
| Path to Correlation Metrics Output File | The output file path for each event (must be unique for each entry) |
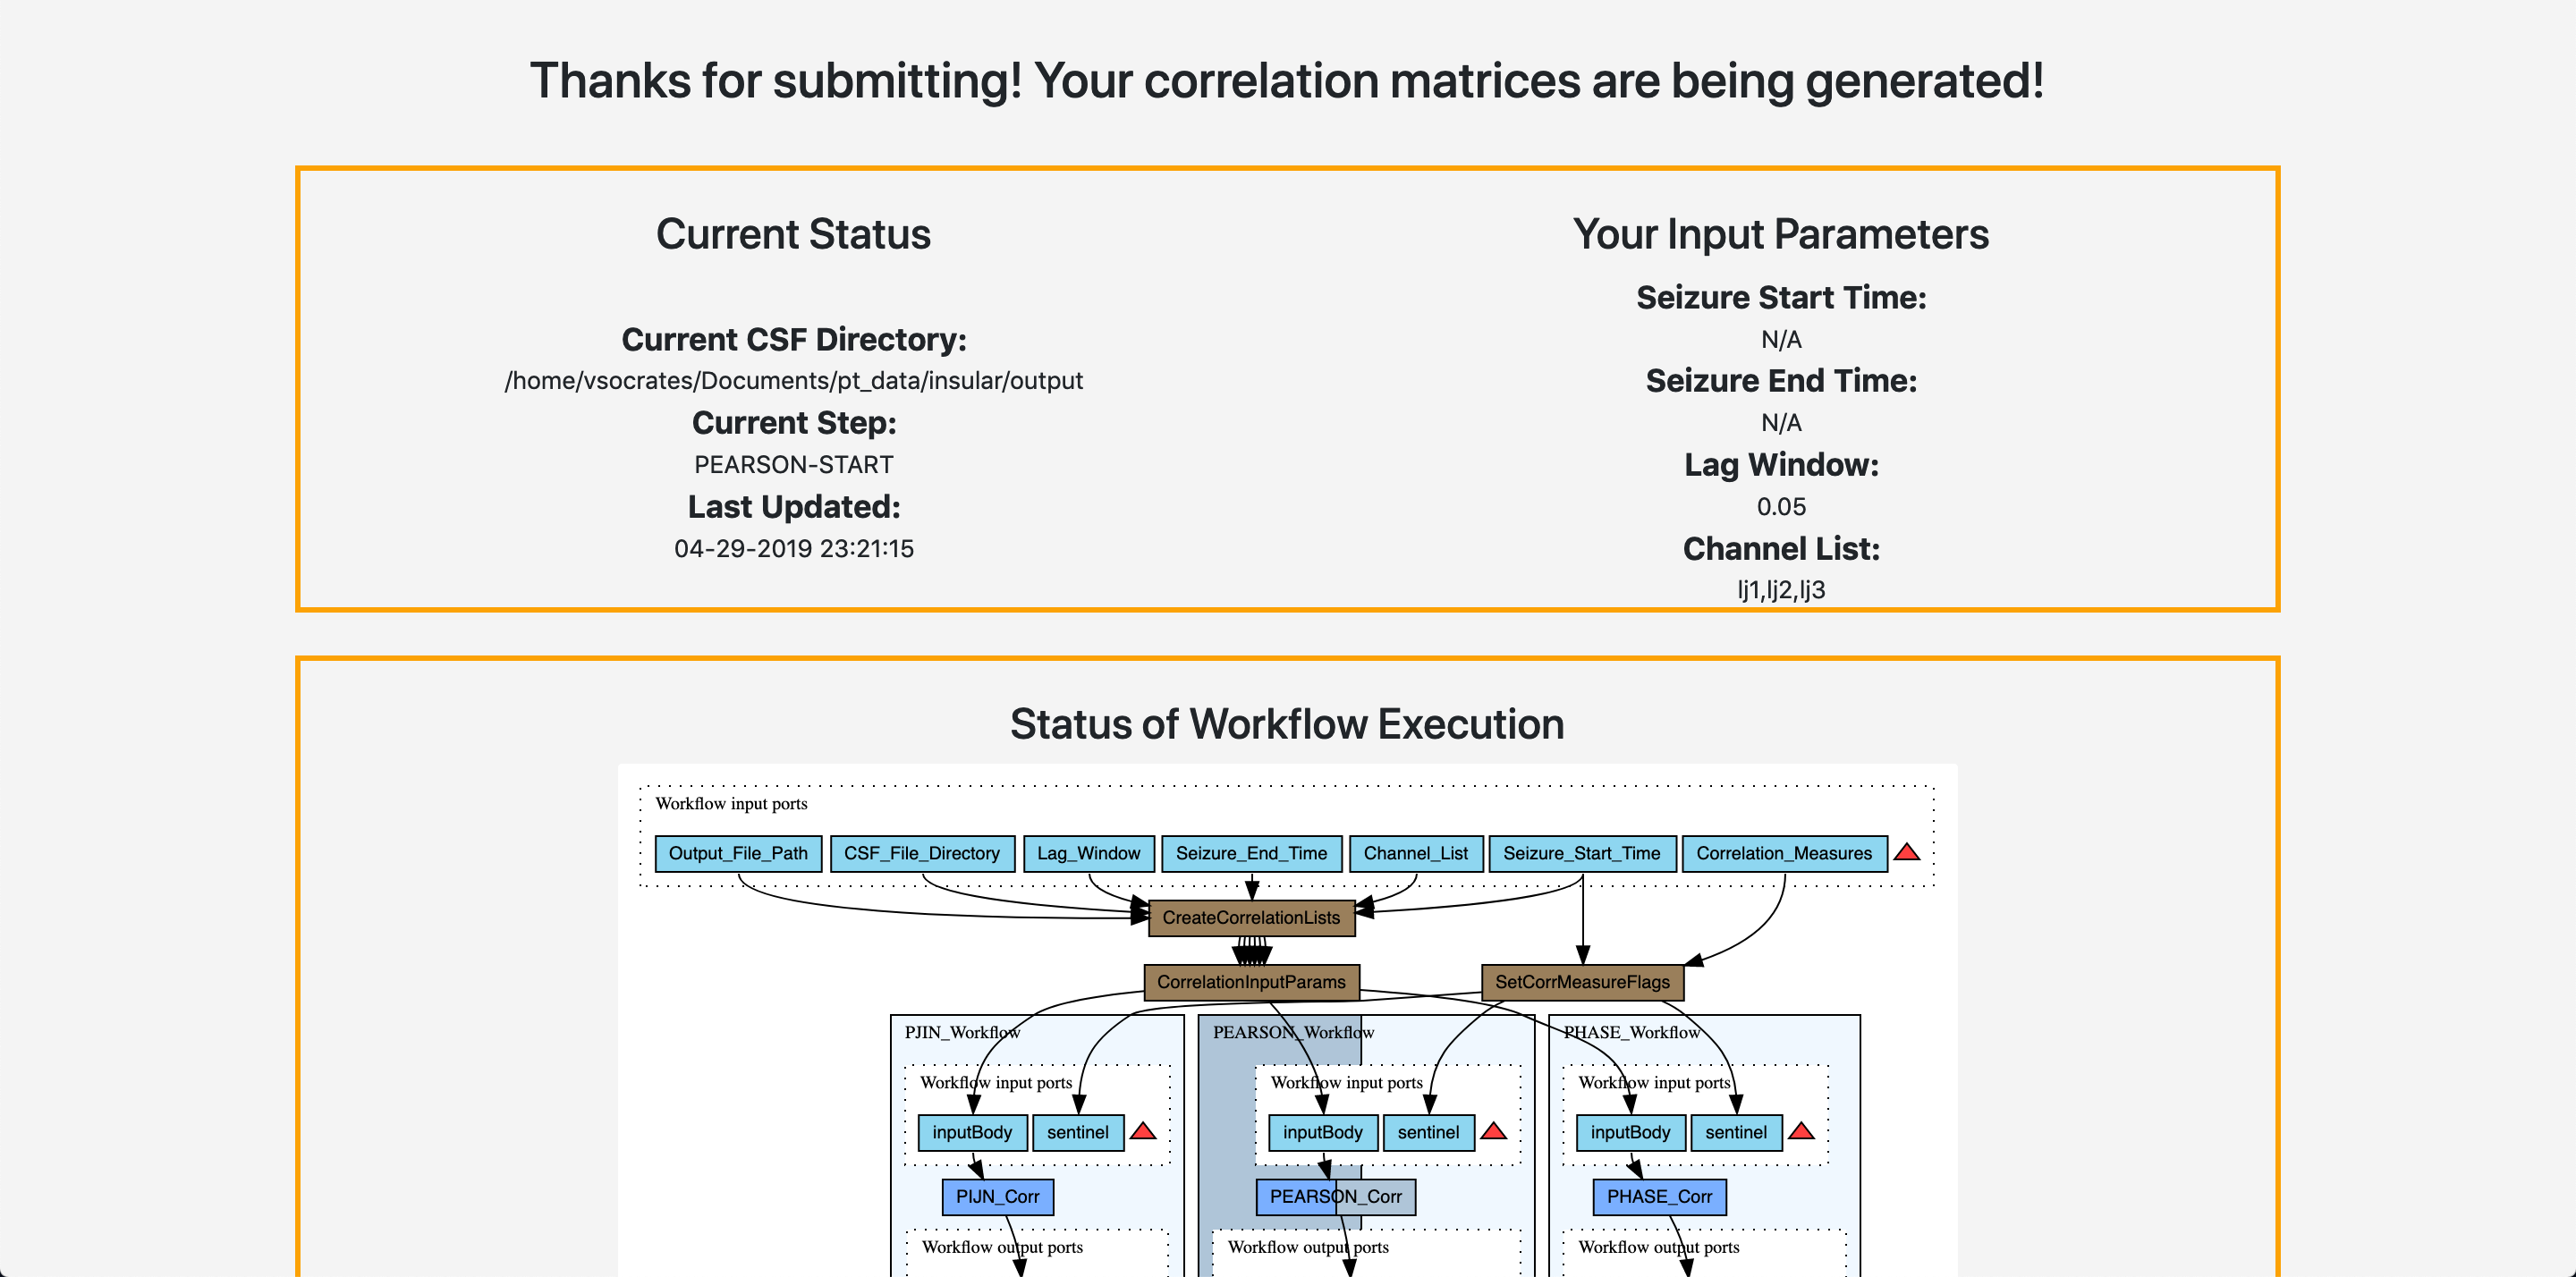
Once you click Run Correlations you will be taken to a very similar screen that allows you to view your status as shown below:
Again, a popup will take you to the next step, network analysis.